Flux Data Processing – Workflow Summary
Utah Geological Survey · Flux Monitoring Network Station reference implementation: US-UTD (Dugout Ranch)
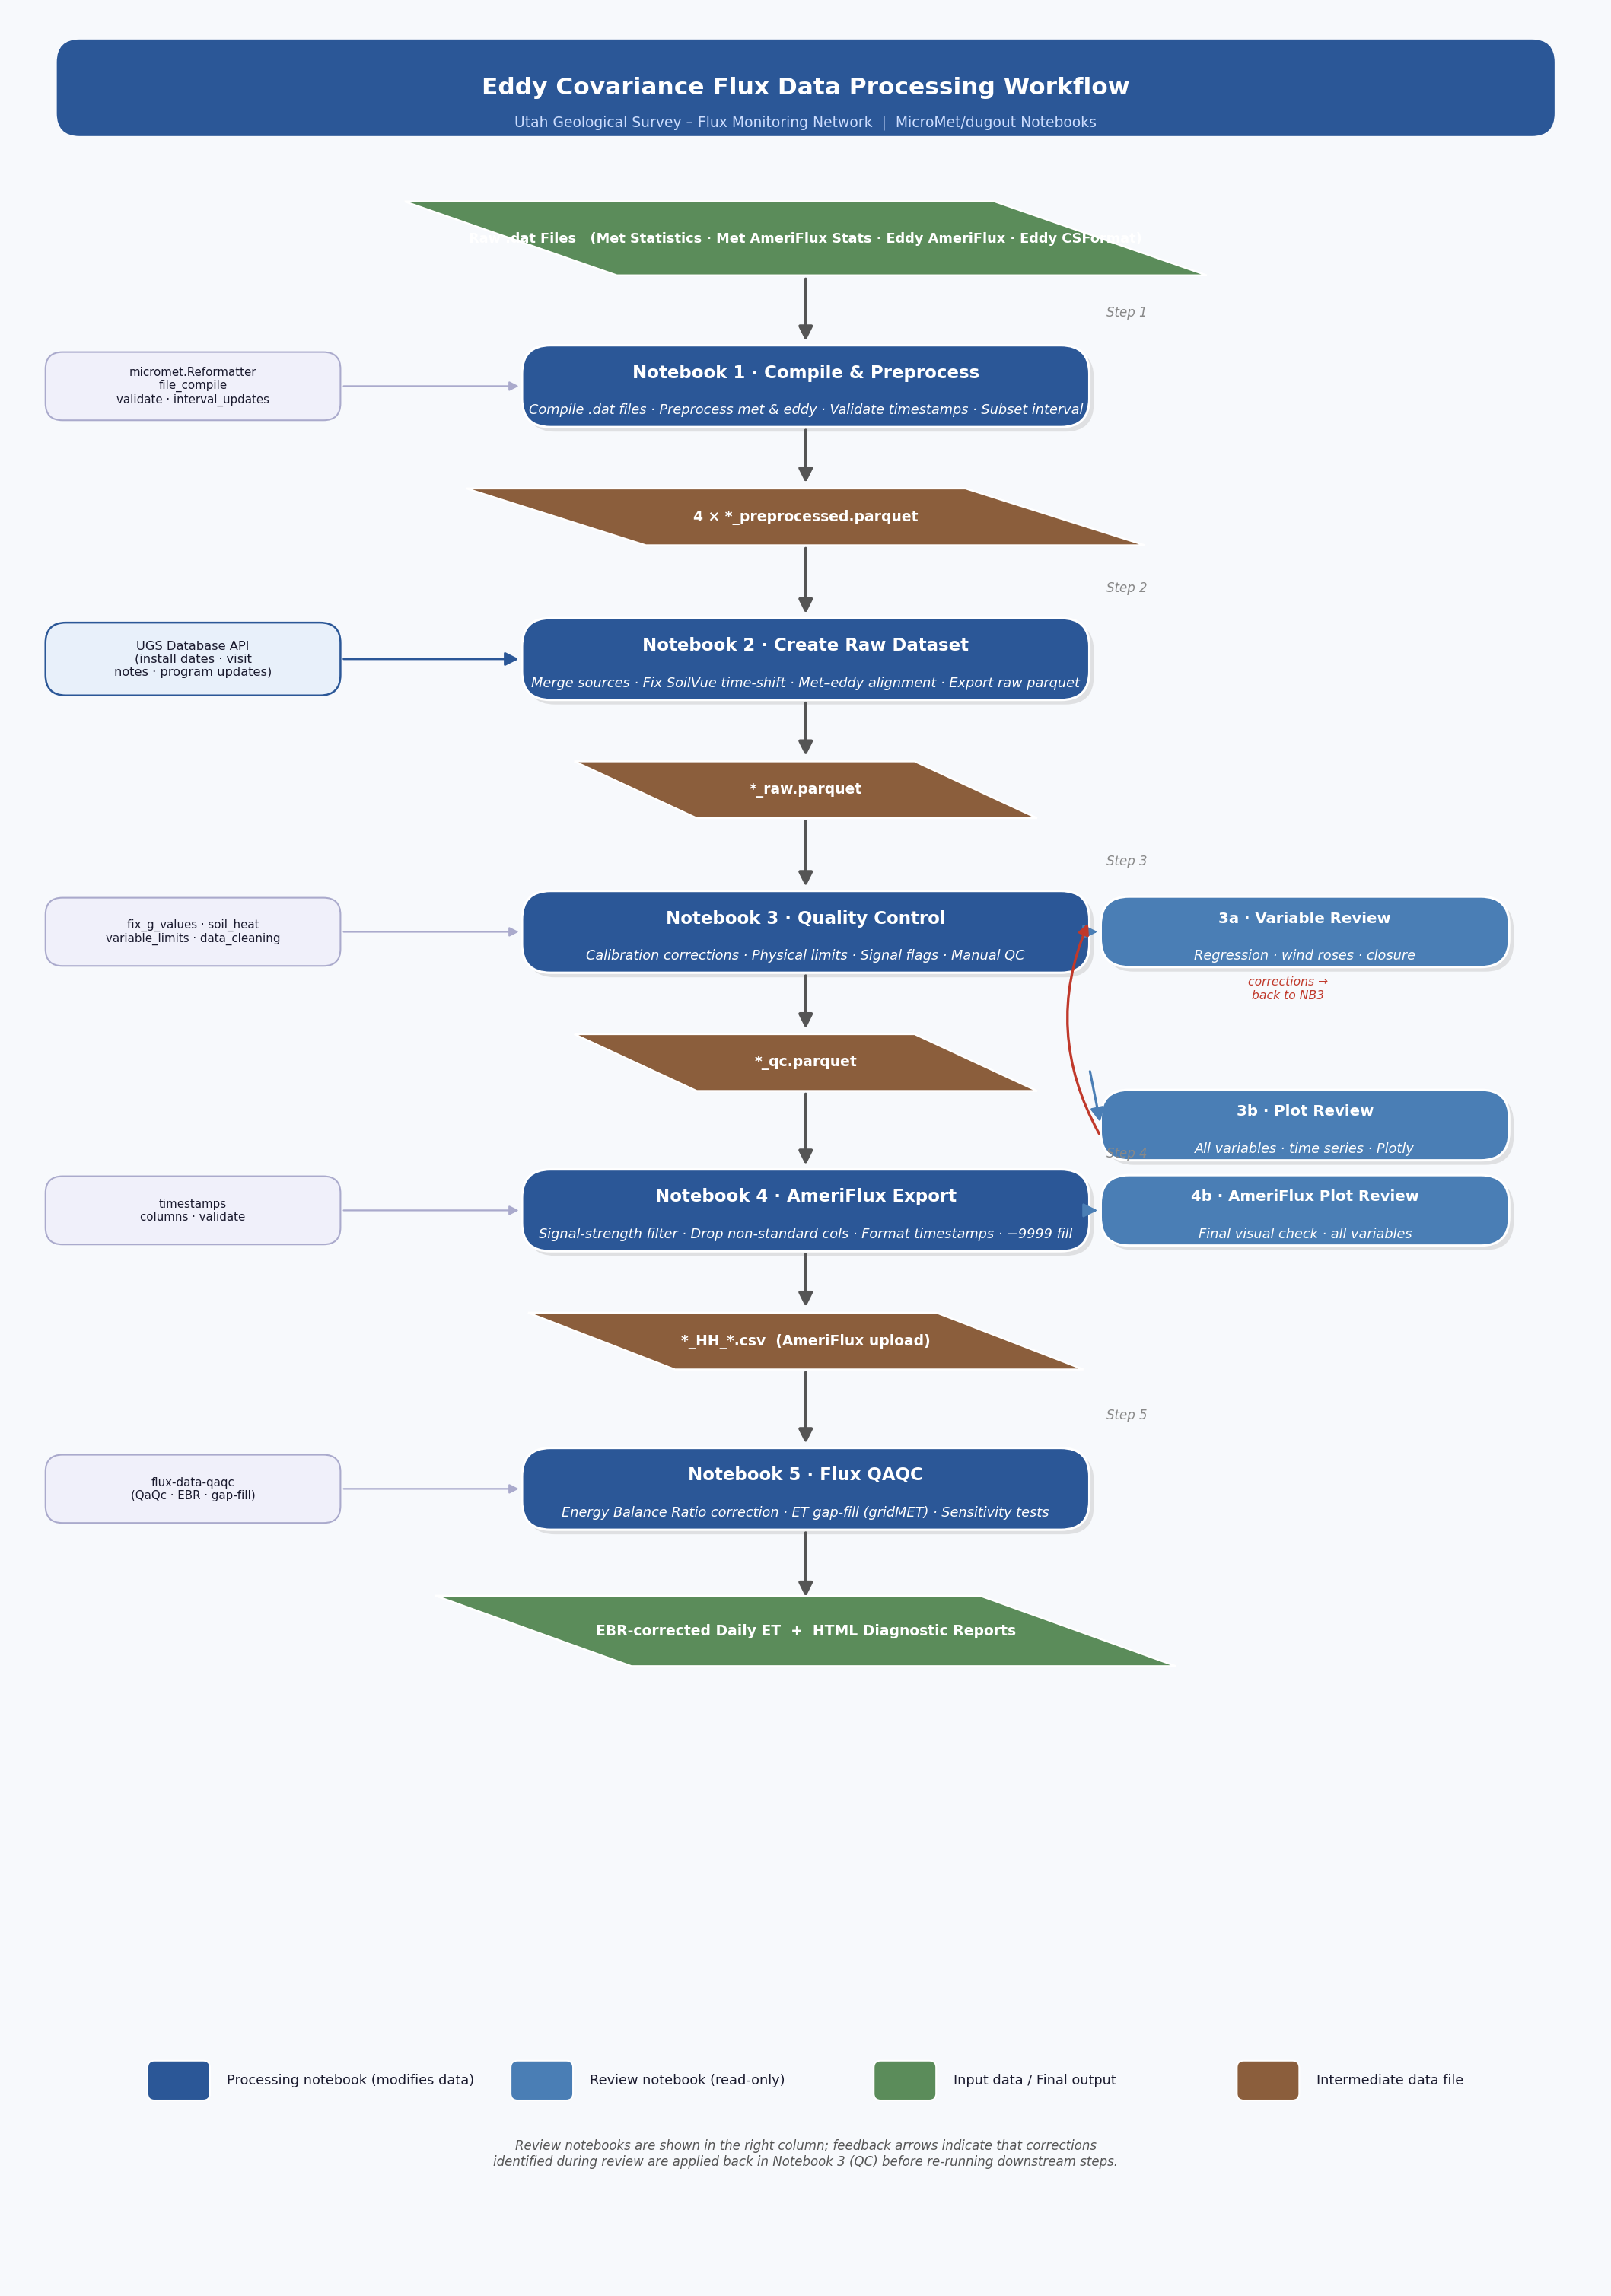
This page provides a high-level overview of the end-to-end eddy covariance data processing pipeline. For full technical detail on each step, see the complete workflow reference.
Workflow Flowchart
Pipeline at a Glance
The pipeline converts raw Campbell Scientific .dat files into quality-controlled, AmeriFlux-formatted output through six processing steps and three review checkpoints.
Step |
Notebook |
Input |
Key Operations |
Output |
|---|---|---|---|---|
|
Raw |
Compile files · run |
4 × |
|
|
Preprocessed parquets |
Merge eddy & met · fix SoilVue time-shift · align met–eddy · standardise columns |
|
|
|
|
Calibration corrections · |
|
|
|
|
Signal-strength filter · drop non-AmeriFlux cols · format timestamps · fill −9999 |
|
|
|
|
Gap-fill NETRAD/G · EBR correction · ET gap-fill (gridMET) · sensitivity tests |
Daily ET + HTML reports |
Review notebooks (read-only — findings feed corrections back into Step 3):
Notebook |
When to run |
Purpose |
|---|---|---|
After Step 3 |
Regression, wind roses, energy-balance closure, sensor intercomparison |
|
After Step 3 |
Quick time-series sweep of every variable |
|
After Step 4 |
Final visual check before AmeriFlux submission |
Step-by-Step Summary
Step 1 · Compile & Preprocess
Four data streams are assembled from the shared drive and run through micromet.Reformatter.preprocess():
Met Statistics (TOA5 format) — strips
_Avg/_Totsuffixes, standardises timestampsMet AmeriFlux Statistics — renames leaf-wetness columns, drops all-NA artefact columns
Eddy AmeriFlux Format — validates against AmeriFlux master variable list
Eddy CS Format — renames Campbell-specific columns, adds diagnostic variables absent from AmeriFlux format
All streams are filtered to the target interval (30 or 60 min) via interval_updates.subset_interval().
Outputs: {stationid}_{interval}_{source}_preprocessed.parquet × 4
Step 2 · Create Raw Dataset
The four preprocessed streams are merged into one coherent dataset:
Eddy merge — AmeriFlux format is the primary stream; CS Format fills gaps and supplies unique columns (
G_PLATE,FC_MASS,TKE,TSTAR, wind components).SoilVue time-shift — SoilVue profile columns (
EC_3_*,K_3_*,SWC_3_*,TS_3_*) in the AmeriFlux Statistics table are often offset by 30 min. Cross-correlation viavalidate.review_lags()detects the lag;shift(freq='30min')corrects it.Met–eddy alignment —
validate.detect_sectional_offsets_indexed()checks for systematic offsets betweenNETRADandWSacross the two systems; any detected shift is corrected.Column cleanup — duplicates renamed (
FILE_NAME_EDDY,FILE_NAME_MET); derived columns dropped;_1_1_1suffixes applied; data before install date removed.
Output: {stationid}_{start}_{end}_raw.parquet
Step 3 · Quality Control
The largest and most site-specific step. Key operations in sequence:
Calibration corrections (date-gated using program-update records)
Soil heat flux storage: incorrect layer thickness (0.16 m → 0.05 m) corrected by factor 0.3125
G_PLATE_2sign inversion corrected for affected periodTipping bucket precipitation: calibration factor 0.1 → 0.254 (×2.54)
SoilVue G calculation —
soil_heatlibrary computesSG_3_1_1and conductive flux;G_3_1_1 = SG_3_1_1 + G_SOILVUEMicroMet finalize — converts SWC fraction → percent; applies physical limits; standardises SSITC encoding; produces limit report
Manual corrections — field-day precip cleanup, G_PLATE zeros, SoilVue spikes, wind-direction offsets, pressure/temperature spikes, footprint outliers, failed sensor nulling
Signal-strength flags —
H2O_SIG_FLAG_1_1_1andCO2_SIG_FLAG_1_1_1(0 = good / 1 = marginal / 2 = known bad period);WD_1_1_1_FLAGfor tower obstruction sector
Output: {stationid}_{daterange}_qc.parquet
Review: 3a & 3b
Run after Step 3 to evaluate data quality. Any issues found here are resolved by adding new correction blocks in Notebook 3 and re-running Steps 3–5.
3a covers: radiation intercomparison, albedo, wind speed/direction regression, soil heat flux plate vs. SoilVue, temperature sensor agreement, RH/VPD signal-strength stratification, energy balance closure.
3b: iterates over all columns and produces an interactive Plotly time-series for each.
Step 4 · AmeriFlux Export
Converts the QC parquet into an AmeriFlux-ready half-hourly CSV:
IRGA-derived variables (LE, H2O, CO2, RH, ET) set to NaN where signal strength < 0.8
Non-AmeriFlux columns dropped (internal flags, diagnostic fields, temporal helpers)
NaN → −9999; timestamps regenerated in
YYYYMMDDHHmmformatFinal file retains ~80 variables across flux, radiation, temperature, humidity, soil, and wind categories
Output: {stationid}_HH_{start}_{end}.csv
Step 5 · Flux QAQC
Runs flux-data-qaqc to perform Energy Balance Ratio (EBR) correction and ET gap-filling:
Redundant sensors (
NETRAD_1_1_1/NETRAD_1_1_2;G_1_1_A/G_3_1_1) are cross-regressed to fill gaps before passing to QAQCEBR correction applied to LE; corrected ET gap-filled using ETrF × gridMET ETr
Sensitivity runs with different Rn and G input combinations produce separate HTML reports for comparison
Outputs: EBR-corrected daily ET, HTML diagnostic reports, optional daily CSV
Key Libraries
Library |
Role |
|---|---|
Core pipeline: |
|
soil_heat |
SoilVue-derived ground heat flux ( |
fluxdataqaqc |
EBR correction, ET gap-fill ( |
pandas / numpy |
Data wrangling and array operations |
scipy |
Cross-correlation and linear regression |
plotly / bokeh |
Interactive diagnostics and HTML reports |
Directory Structure
M:/Shared drives/UGS_Flux/
├── Data_Downloads/compiled/{stationid}/     ← raw .dat source files
│   ├── Statistics/
│   ├── Statistics_Ameriflux/
│   ├── AmeriFluxFormat/
│   └── Flux_CSFormat/
└── Data_Processing/final_database_tables/   ← processed outputs
    ├── raw/          *_raw.parquet
    ├── qc/           *_qc.parquet
    └── ameriflux/    *_HH_*.csv
Adapting to Other Sites
Copy the dugout notebooks and update:
stationid,interval— station code and measurement intervalCalibration correction dates and factors in Notebook 3
Sensor failure date ranges and affected variable lists
Wind direction offset between sonic and Young anemometer
Signal-strength bad-period date ranges
csflux_join_colsin Notebook 2 (site-dependent sensor array).iniconfig for flux-data-qaqc (Notebook 5)
See the full workflow document for detailed guidance.